Confusion Matrix in Machine Learning
In this page we will learn Confusion Matrix in Machine Learning, What is Confusion Matrix in Machine Learning?, Need for Confusion Matrix in Machine learning, Calculations using Confusion Matrix, Classification Accuracy, Misclassification rate, Null Error rate, ROC Curve.
What is Confusion Matrix in Machine Learning?
The confusion matrix is a matrix that is used to evaluate the classification models' performance for a given set of test data. Only if the true values for test data are known can it be determined. The matrix itself is simple to comprehend, but the associated terminologies might be perplexing. It's also known as an error matrix since it displays the flaws in the model's performance as a matrix. The following are some of the characteristics of the Confusion matrix:
- The matrix for two prediction classes of classifiers is a 2*2 table, for 3 classes, a 3*3 table, and so on.
- Predicted values and actual values, as well as the total number of predictions, are separated into two dimensions in the matrix.
- Actual values are the true values for the provided observations, whereas projected values are those anticipated by the model.
- It appears as follows in the table:
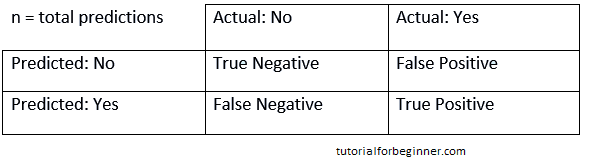
The following cases are listed in the table above:
- True Negative: The model predicted No, and the real or actual value likewise predicted No.
- True Positive: The model correctly predicted yes, and the actual value matched.
- False Negative: The model predicted no, but the true value was Yes; this is known as a Type-II error.
- False Positive: The model predicted Yes, but the value was really No. It's also known as a Type-I error.
Need for Confusion Matrix in Machine learning
- It assesses the classification models' performance when they make predictions on test data and determines how good our classification model is.
- It not only indicates the type of error made by the classifiers, but also whether it is a type-I or type-II error.
- We can determine the model's various parameters, such as accuracy, precision, and so on, using the confusion matrix.
An example will help us grasp the confusion matrix.
Example: Assume we're attempting to develop a model that can predict the outcome of a disease, which is whether or not a person has the condition. As a result, the confusion matrix for this is as follows:
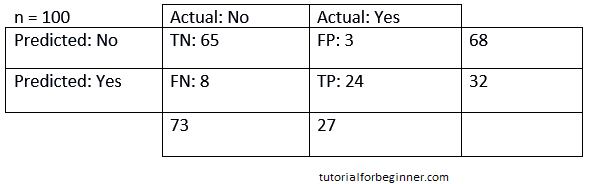
We can deduce from the preceding case that:
- The table is for a two-class classifier with two predictions: "Yes" and "No." Yes indicates that the patient has the disease, whereas No indicates that the patient does not.
- A total of 100 predictions have been made by the classifier. Out of a total of 100 predictions, 89 are correct and 11 are erroneous.
- The model has correctly predicted 32 times and incorrectly predicted 68 times. The true "Yes" was 27 times, while the actual "No" was 73 times.
Calculations using Confusion Matrix:
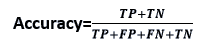
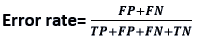
Using this matrix, we may conduct numerous computations for the model, such as the model's accuracy. The following are the results of these calculations:
- Classification Accuracy: One of the most essential metrics for determining the accuracy of classification problems is classification accuracy. It specifies how often the model correctly predicts the outcome. The ratio of the number of right predictions produced by the classifier to the total number of predictions made by the classifiers can be determined. The formula is as follows:
- Misclassification rate: The misclassification rate, often known as the error rate, indicates how frequently the model makes incorrect predictions. The number of inaccurate predictions divided by the total number of predictions made by the classifier is the error rate. The formula is as follows:
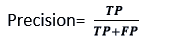
- Precision: Precision can be defined as the number of correct outputs supplied by the model or the percentage of all positive classifications that the model correctly predicted being true. The following formula can be used to compute it:
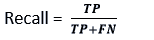
- Recall: It is defined as the percentage of positive classes that our model accurately predicted out of a total of positive classes. It is critical that the recall rate be as high as feasible.
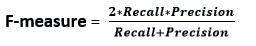
- F-measure: It's difficult to compare two models that have low precision but good recall, or vice versa. As a result, we can employ F-score for this purpose. This score allows us to assess both recall and precision simultaneously. If the recall and precision are equal, the F-score is maximum. The following formula can be used to compute it:
Other key terms in Confusion Matrix include:
- Null Error rate: The null error rate is the percentage of times our model would be wrong if it always predicted the majority class. "The best classifier has a larger mistake rate than the null error rate," according to the accuracy paradox.
- ROC Curve: The ROC Curve is a graph that shows the performance of a classifier for all conceivable thresholds. The graph shows the genuine positive rate (on the Y-axis) and the false positive rate (on the X-axis) (on the x-axis).