P Value in Machine Learning
In this page we will learn about What is P Value in Machine Learning?, Hypothesis Testing, Steps for Hypothesis testing, Normal Distribution, Statistical significance, Errors in P value Type I Error, Type II Error, Importance of P value.
What is P Value in Machine Learning?
The P value, also known as the probability value, is used in statistical hypothesis testing to examine test results or more extreme results by assuming that the null hypothesis (H0) is true. There are many notions in data science that have been borrowed from many disciplines, and the p-value is one of them. The p-value is a statistical notion that is commonly utilized in machine learning and data science.
- In order to establish the minimal significance level at which the null hypothesis is least or rejected, the P-value is also utilized as an alternative to identify the point of rejection.
- It is stated as a level of significance that ranges from 0 to 1, with a smaller p-value indicating strong evidence for rejecting the null hypothesis. If the p-value is very little, it suggests that the observed output is plausible but does not fall under the null hypothesis (H0).
-
The level of significance () is defined as a p-value of
0.05. It is usually considered utilizing the following two
suggestions:
- If the p-value is greater than 0.05, the null hypothesis must be accepted.
- If the p-value is less than 0.05, the null hypothesis must be rejected, and the result is declared statistically significant.
Our major goal in statistics is to establish the statistical significance of our results, which is based on the following three concepts:
- Hypothesis Testing
- Normal Distribution
- Statistical Significance
Let's understand each of them.
Hypothesis Testing
The terms "null hypothesis" and "alternative hypothesis" are used to describe hypothesis testing. It's used to see if the null hypothesis or assertion made with the sample data is correct. The null hypothesis (H0) is defined as a hypothesis in which there is no statistical significance between two variables, whereas the alternative hypothesis (H1) is defined as a hypothesis in which there is statistical significance between two variables. Because there is no substantial association between the two variables, one variable will have no effect on the other. As a result, the Null hypothesis states that what you're about to prove isn't true. The alternate hypothesis condition is shown when the independent variable has no effect on the dependent variable.
To put it another way, in hypothesis testing, we first formulate a claim that is supposed to be a null hypothesis based on the sample data. If this assertion is proven to be false, the alternative hypothesis is chosen. The evidence is used to validate this assumption or claim using the p-value to verify if it is statistically significant or not. The null hypothesis is rejected if the evidence supports the alternative hypothesis.
Steps for Hypothesis testing
The steps for conducting a hypothesis-testing experiment are as follows:
- Declare or claim the experiment's null hypothesis.
- The alternative hypothesis, which is the polar opposite of the null hypothesis, should be stated.
- Determine the alpha value that will be utilized in the experiment.
- Using the normal distribution, calculate the z-score.
- To verify statistical significance, compare the P-value.
Normal Distribution
The Probability distribution function is the normal distribution, commonly known as the Gaussian distribution. It's symmetric about the mean, and it's used to visualize data distribution using a graph plot. It depicts that data around the mean is more likely to occur than data distant from the mean, and it resembles a bell-shaped curve. The mean(μ) and standard deviation() are the two most important terms in the normal distribution. The mean of a normal distribution is 0 and the standard deviation is 1.
In hypothesis testing, the z-score must be calculated. The number of standard deviations from the mean of a data point is known as the Z-score.
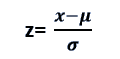
Here, the z-score inform us that where the data lies compared to the average population.
Statistical significance:
The purpose of computing the p-value is to evaluate the statistical significance of the hypothesis test. To do so, we must first establish a threshold, which is referred to as alpha. Before starting the experiment, we should always set the alpha value, which is either 0.05 or 0.01. (depending on the type of problem).
If the observed p-value is less than alpha, the result is considered significant.
Errors in P-value
Two types of errors are defined for the p-value; these errors are given below:
- Type I error
- Type II error
Type I Error:
It is defined as the rejection of the Null hypothesis that is wrong or false. The greatest likelihood for this inaccuracy is alpha, which is predetermined. The sample size of the dataset has no bearing on the inaccuracy. As the number of tests or endpoints grows, so does the type I error.
Type II Error:
The erroneous acceptance of the Null hypothesis is referred to as a Type II mistake. The probability of making a type II error is called beta, and it is determined by the sample size and alpha value. As a function of the genuine population effect, the beta cannot be established. Beta is inversely proportional to sample size, which indicates that as the sample size grows, beta drops.
When we increase the number of tests or endpoints, the value of beta lowers as well.
On the basis of the table below, we can comprehend the relationship between hypothesis testing and decision:
| Decision | Decision | |
|---|---|---|
| Truth | Accept H0 | Reject H0 |
| H0 is true | Correct decision | Type I error |
| H0 is false | Type II error | Correct decision |
Importance of P-value
The significance of the p-value can be seen in two ways:
- Statistics Aspect: The idea of the p-value is crucial in statistics for hypothesis testing and statistical approaches such as regression.
- Data Science Aspect: It is also an important aspect of data science. The lower p-value indicates that there is a link between the predictor and the response. It is recommended that while working with a machine learning challenge in data science, the p-value be carefully considered.